The memory inspector shows the content of memory locations in various formats.
In the top right corner of the inspector you find an edit box, where you can enter an address. This address is used to position the display of memory locations below at the given address.
Next to it, on the left, there are the format checkbuttons. Pressing one will change the format used to display the memory content. The choices are
Next to the left comes the chunk size checkboxes. Pressing one will change the size of the memory chunks that are displayed below. You can choose between
You can combine any chunk size with any format, except that the Float format is available only for Tetra or Octa
sized chunks.
(Consider: In TETRA chunk size float numbers might be dsiplayed as short float!)
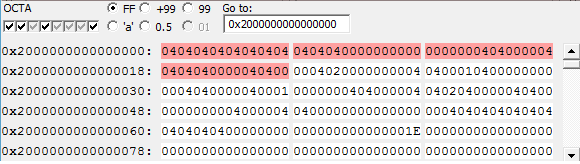
Below these Buttons, are several lines showing the content of memory locations.
Each line starts with the address of the first byte shown in this line. Then the memory content is shown using the selected chunk size and format.
Whenever the program changes the content of a memory location currently visible in the display, the content is shown in red. This should help you spot the point where changes occur in memory.
The individual chunks are aligned; that is, an Octa will start at an address that is a multiple of 8, a Tetra will start at an address that is a multiple of 4, and a Wyde will start at an address that is even.
On the right side of the window is a scrollbar. You can use it to scroll up and down in the displayed memory region. When the scrollbar reaches the bottom of the window, you still can continue to scroll down by using the page down button of the scroll bar. The same is true when you reach the top of the window with the restriction, that you can not scroll past the address given in the top right edit window.
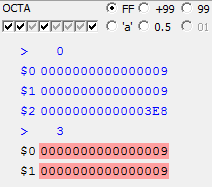
The register inspector works is very similar to the memory inspector. There is, however, no edit boy to enter a start address, and each line starts with a register name instead of an address.
The window that shows the local registers will dynamicaly update to show only the current local registers. Registers that become marginal will disappear from the display.
If the display of the register stack is enabled (either automaticaly by selecting the appropriate check box in the Debugger Options, or manualy in the Register submenu of the View menu), also the registers hidden on the register stack are shown. These registers are shown in light gray using the register numbers that they will have once they become accessible again. The register that separates the current local registers from the hidden registers below contains the size of the next stack frame. Instead of the register name, just a hyphen is shown, because this register will never become visible, execpt if overwritten by a return value.
 Memory and register inspectors can be used to inspect data, but you can not use them to alter data. For this purpose
you need the Data Editor.
Memory and register inspectors can be used to inspect data, but you can not use them to alter data. For this purpose
you need the Data Editor.
To open the Data Editor, just double-click on any data item on display in an inspector window. If a data editor is not yet open, a new data editor will be created; otherwise, the existing data editor will be repositioned to the data item just double clicked.
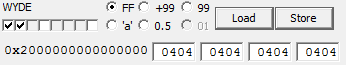
The data editor has a format button and a chunk size button just as a memory inspector. In addition it features a Load and a Store button.
Unlike an inspector, the data editor will display just the data selected by the double click; that is, at most one Octa. Of course, the chunk size can be made smaller later on, for example to split an Octa into four Wydes as shown above.
The data is displayed in a number of edit boxes, that can be altered as usual, as long as they conform to the specified format.